Tuesday, July 31, 2007

Shadow of a moon and Kelvin-Helmholtz waves

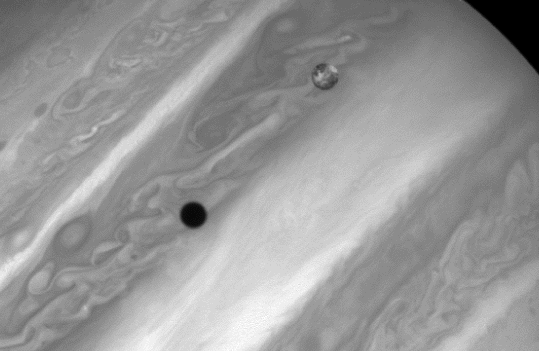
I saw this photo on Terra Que Gira a little earlier. Not only is it a striking photo...I just love that sharp, black circle against the more diffuse and swirly background of Jupiter's atmosphere...but it also shows some nice Kelvin-Helmholtz waves, which are trains of waves typically marking a boundary or interface between two layers or regions of different turbulent behavior (commonly due to different densities). They happen in all kinds of fluids....sometimes you may even see them in clouds on Earth.

In a temporal sense, they commonly define the conspicuously organized transition from non-turbulent (laminar) flow to the much more random behavior of fully turbulent bursts and sweeps.

Check out this movie below of a simulation (click on it to go to movie, then go here for explanation)


Although they do occur in sedimentary features (bedforms), perfectly preserved examples of them are hard to come by.

Read more about the fluid mechanics of Kelvin-Helmholtz instabilities here, here, and here.

I hate futons

That's right. I hate them. Yes, it is a serious word. And I mean it.

I helped a friend move today. I'm happy to do it, because with good friends you always know what comes around goes around. Plus, moving is one of those things where you notice how much faster and efficient it goes when you have a group of people helping.

Futons are the worst things ever conceived and constructed. I've always hated everything about them. They are not comfortable to sit on. They are certainly not comfortable to sleep on. But, it is moving day when my hatred for futons really comes out.

When you try and pick the thing up, one side tries to fold over and slice off and/or crush your fingers. As you and the other sorry soul who is trying to carry the thing with you attempt to rotate only slightly to get out the door, then the other side slams down. Why isn't there some sort of fastening device included with this overly-complicated folding monstrosity?

And that's just the frame. Then the so-called mattress. If there is any piece of furniture that, when carried, resembles a dead body it must be the futon mattress.

I'm not sure why, but i assumed the futon was invented by the Swedish or someone else in northern Europe, but apparently it is a Japanese idea. I have no basis for saying this, but I bet the Japanese futons are better somehow. Not good by any means....but better.

I hate futons.

If anyone has anything to say in defense of futons.....I would like to hear it.


image above from here

Sunday, July 29, 2007

Theoretical Stratigraphy, Part I: Wheeler's baselevel

This post reviews some fundamental concepts of stratigraphy that are discussed in a 1964 GSA Bulletin paper by Harry Wheeler. At the same time, it is an essay about my own quest to really understand how time is recorded in rocks.


I was introduced to this paper and its ideas in an advanced stratigraphy class I took during my master's program a few years back. Wheeler's writing style is abstract and sometimes obtuse, but also very creative and profound. He has a handful of papers in the 1950s and 60s dealing with stratigraphic theory but I think the 1964 paper discussed here is the best summary of his ideas. This is one of those papers that you will need to read over and over again to "get it". I learn something new every time. Historically, this is an important paper; a contemporary of Wheeler (and reviewer of the paper) was Larry Sloss, who published a famous paper in 1963 dealing with unconformity-bounded stratigraphic sequences in North America. Sloss was the mentor of Peter Vail, who is credited (along with his Exxon colleagues) with spearheading what is now referred to as seismic stratigraphy or sequence stratigraphy in the 1970s. I will deal with the Sloss-Vail view of stratigraphy another time.

First, to whet your appetite....let's start with one of my favorite passages from Wheeler's paper:
"...the constantly varying undulations of the baselevel surface relative to the ever-changing lithosphere surface may be seen as a consistent function of the ebb and flow of depositional and erosional environments in the space-time continuum."
This single statement captures Wheeler's view of how to approach unraveling the stratigraphic record. Laying out the concept of stratigraphic baselevel, which is fundamental to this view, is the thesis of this paper.


Review of the Baselevel Concept
John Wesley Powell first explicitly discussed base level in 1875 as the ultimate lower surface beneath which rocks cannot be eroded. He proposed this in his writings after exploring and mapping the landforms of the Colorado Plateau region. In this view, sea level is the "grand base level". This idea is intuitive and is still an important concept in areas of geomorphology that deal with net erosion and denudation of the Earth's surface. As Wheeler discusses in the opening paragraphs, Barrell (1917) is credited with extending the baselevel concept into the depositional realm. Here I quote Wheeler quoting Barrell:
"Thus the sediments [are] deposited with respect to a nearly horizontal controlling surface. This surface of control is baselevel [which is] of more inclusive content than the sense in which has generally been used by physiographers as a level of limiting the depth of fluvial erosion. Sedimentation as well as erosion is controlled by baselevel [which] is that surface toward which external forces strive, the surface at which neither erosion nor sedimentation takes place." (Bracketed words are Wheeler's.)
One of Wheeler's contributions to the development of the baselevel concept is his challenge that it is actually a "controlling" force.
"Although baselevel is indeed important, it exists as a surface only in the human mind; it controls nothing."
A statement like this could open a can of worms regarding how science in general deals with forces of nature and how best to discuss them, but let's focus on Wheeler's point. What he is saying is that viewing baselevel as a control is limiting. Regarding baselevel as a descriptor is much more inclusive and holistic, for lack of a better term. Wheeler argues that viewing the phase of degradation and aggradation of the Earth's surface as having separate controls and also being split into separate scientific disciplines as misguided:
"Many inadequacies of concept and practice stem from the popular notion that stratigraphy is the science of past sedimentation, to the exclusion of degradation; but if time is properly incorporated in the system, stratigraphers must concern themselves with the interpretation of degradational as well as aggradational patterns. Conversely, the geomorphologist who ignores depositional phenomena is equally delinquent."
In practice, of course, stratigraphy and geomorphology are intertwined, yet distinct disciplines. When dealing with parts of the Earth's surface that are net depositional vs. net erosional different concepts and tools are utilized to characterize and understand them. But what Wheeler is getting at is much more fundamental.

The next major aspect of baselevel that Wheeler discusses is that it is not a horizontal surface. The figure below is straight from the paper (click on it to see a larger version and caption).


Wheeler argues that thinking of baselevel as a horizontal surface results in numerous baselevel surfaces that come and go in time. Moreover, either deposition or erosion could occur above or below these multiple surfaces at any one time, which further complicates the notion that there is a single, horizontal controlling surface. One argument is that the other, multiple surfaces are temporary and thus not the ultimate baselevel. Wheeler's view of a baselevel surface, shown in lower half the figure, is that it is a non-horizontal surface that describes what the Earth's surface, or the lithosphere surface as he calls it, is doing at that time. In other words, if degradation (erosion) is occuring, baselevel is "falling"; if the lithosphere surface is aggrading (deposition), then baselevel is "rising". I will come back to this....for now, let's move on.


Law of Lithosphere Relationships
Wheeler then discusses how the differement "movements" of the lithosphere surface relate to the passage of time. This is where his ideas get interesting.
"But what of stratigraphic discontinuities as manifestations of nondeposition and accompanying erosion? Here we pass into the realm of no less important but completely abstract, area-time framework, in which a discontinuity takes on 'area-time' configuration in the form of the lacuna, which in turn, consists of hiatus and degradation vacuity."
Here, he is emphasizing the temporal value of nondeposition and erosion. It is intuitive to think about the passage of time when looking at a vertical column of stratigraphy. And the importance of significant unconformities goes back to the very foundation of the science of geology. Wheeler is proposing a more formal subdivision of this so-called "missing" time. Of course, there is no "missing" time....it is simply recorded as a surface and not as a deposit. The entire segment of time as surface, given the fantastic name of lacuna, is subdivided into two parts:
  • hiatus = time value of nondeposition and erosion
  • degradation vacuity = time value of previous deposits that were removed by erosion
This is important. Wheeler points out that there are three separate domains of time (nondeposition, erosion, and what has been removed) all potentially recorded in a single surface!! He then, in old-school fashion, proposes a formal law of surface relationships as:
"Time as a stratigraphic dimension has meaning only to the extent that any given moment in the Earth's history may be conceived as precisely coinciding with a corresponding worldwide lithosphere surface and all simultaneous events either occurring theoron or directly related thereto."
Wheeler brings his view of baselevel (i.e., the non-horizontal, constantly undulating surface that describes the condition of aggradation or degradation) back in terms of an equilibrium relationship:
"Baselevel thus intersects the lithosphere surface at all points of equilibrium, and its momentary 'depth' beneath or 'height' above the surface at any locality depends...on the relative 'values' of supply and energy."
The terms supply and energy are referring to the flux of sediment and the vigor with which it is transported. In other words, environments of high "energy" are those where erosion (i.e., degradation of lithosphere surface) is more likely. And, if you go back to the figure above, the points of equilibrium are where the dashed line crosses the Earth's surface.


Baselevel Transit Cycle
In this section of the paper, Wheeler discusses the notion of stratigraphic cycles, a concept that has been pondered almost as long as geology has been a science, within the context of baselevel. A cycle of falling baselevel following by rising, or vice-versa, is thus termed a baselevel transit cycle:
"If in an erosional environment at a given locality, the supply-energy ratio increases sufficiently to induce deposition, baselevel is forced upward across the lithosphere surface at that point at the moment deposition beings, thus initiating the first or depositional phase of a new cycle. This cyclic phase continues until the supply-energy ratio is decreased sufficiently to stop deposition and induce erosion, at which time baselevel makes its downward transit of the surface, thus beginning the second or hiatal cyclic phase."
This is getting into the realm of the stratigraphic sequence. As noted above, I will save the discussion of how Wheeler's thinking and Sloss's work have led to our current paradigms in stratigraphic theory. For now, I want to conclude this post with a discussion of Wheeler's summary illustration of these ideas, which is one of my favorite figures of any geology paper.


Area-Time Configurations of Baselevel Transit
The first part of his Figure 2, shown below, is an idealized and hypothetical stratigraphic succession.


This example shows two sequences, A and B, that are separated by an unconformity at the left side of the diagram, and the same two sequences without a discontinuity, and thus one sequence at right (click on it for a larger view). Note the designation of time-equivalent surfaces, A1, A2, A3, etc., associated with each sequence.

The second part of this figure, shown below, takes this succession and puts it into area-time. In other words, the vertical axis is now time rather than depth/thickness. This kind of illustration of stratigraphy has become known as a Wheeler diagram.


If you've made it this far into this post....you should go all the way. It is worth it to look at the larger view of this figure (click on it) and study it in relation to the figure above. Remember, we are now looking at the succession in time:
"Because geologists have not succeeded in developing the means for graphic portrayal of relationships in the space-time continuum, the area-time section is used."
The triangular domain that comes to a point from left to right represents the time recorded as surface, or the lacuna. As discussed above, note how the lacuna is subdivided into the hiatus and degradation vacuity. The "shape" of the lacuna changes across space ... in this example its time value decreases from left to right as the unconformity transitions into a conformity. In other words, there is more "missing" time wrapped up in the unconformity at the left end of the succession. Now, when you compare this back to the corresponding area-thickness plot, you can see how this all fits together. Note how the A5 surface is truncated by the unconformity. And then when examined in the area-time plot you can see the A5 surface across the entire region, but a large portion of it is within the lacuna domain.

Wheeler notes that if we could generate accurate area-time plots such as this for any stratigraphic succession, the concept of baselevel might not be necessary. But, since we cannot, he states:
"...even in time-stratigraphy it would unwise to avoid the role of baselevel, for the fact is most impressive that the constantly varying undulations of the baselevel surface relative to the ever-changing lithosphere surface may be seen as a consistent function of the ebb and flow of depositional and erosional environments in the space-time continuum."
This statement alone is why I think Wheeler's ideas are so important to the science of stratigraphy. It is fundamental to our understanding of Earth history to view a stratigraphic succession as a continuous record. The emphasis on solely the accumulative part of the record misses much (probably most) of the history. Of course, characterizing a history that is so ambiguously represented (i.e., there is nothing there to characterize!) is difficult to impossible at any one location. The point of all this is to develop a theory about how time is recorded in rocks.

In future posts, I will try and put some of Wheeler's concepts within the context of work that came before as well as after this paper.

Friday, July 27, 2007

Friday Field Foto #24: Conglomerate injectites

I don't have a lot of time right now...still traveling...but wanted to get this Friday Field Foto posted while I wait for my flight (hopefully a better experience than the trip here). I'm not traveling at all for the next 5 weeks, so I should be blogging more frequently (and finishing my dissertation).

A paper I'm a co-author on just came out, which I will post about in more detail next week. The photo above (that's me for scale) is a great view of some conglomerate injectites in Cretaceous sedimentary rocks down in Patagonia. I showed a photo of some smaller injectites previously on this blog.

Note the flat lying shale and thin-bedded sandstone that I am standing on juxstaposed against a more resistant conglomeratic body that is nearly vertical.

That must be a fault, right? Wrong. I know this may sound crazy, but this feature represents the upward injection of coarse-grained material through the overlying deposits. Yeah....right. Give me a few days and I'll put together a better explanation of all this. It's pretty wild stuff.

Friday, July 20, 2007

Airport blogging

NOTE: This post has nothing to do with science...it is essentially a rant about unsatisfactory traveling circumstances.

Let's see....it is now Friday night, about 9:20pm and we are sitting in JFK airport in New York City (i just took that photo at left). Yesterday (Thursday) morning, we left San Francisco at a little after noon, although we were supposed to leave at 9am. Delta Airlines says it was weather but I am skeptical. I think that their airline just sucks.

Let me back up for a moment....we are trying to make it to Buffalo, NY to visit some family and friends of mine (this is where I grew up). Why would you fly all the way to New York City and then backwards back to the west to Buffalo you may ask. Because Buffalo is one of those crappy little cities that you can't get to direct from anywhere outside a 800 mile radius. We flew right over the damn place on the way to New York.

So....we landed at JFK last night too late to make our original flight to Buffalo. The last flight, which we were on standby, was then mysteriously canceled. We weren't the only ones screwed....pretty much everyone who was trying to make a connection at JFK got hosed as well. Then we had to stand in a very long line of very unhappy people to find out when we would actually leave. And apparently airlines no longer get you a hotel room....sweet....we have to find a place to stay.

But wait....there's more! Now we head down to baggage claim to get our bags that never got put on the flight to Buffalo (since it never happened). They don't know where they are. Excellent. They find them after about an hour and half....I think if they would've simply let me behind those doors saying AUTHORIZED PERSONNEL ONLY I could have found them in 5 minutes! Miraculously, our and many others bags are found. People erupted with screams of joy and excitement.

Then we try and find a motel....we ended up about 30 minutes to the east on Long Island. I'm pretty certain that this motel service at JFK is in cahoots with the taxi companies so they can drive people like us who don't know anything wherever they want. Our cabbie even pretended to not know where the place was....yeah, right.

On a positive note, we ended up hanging out with some good friends who live in Brooklyn all day today. It was a beautiful day and we had a nice big lunch with some beers at a streetside cafe. So, it wasn't all bad. As an aside, we tried calling these same friends last night to crash, but alas it was too late and they had gone to bed.

So...now we are sitting waiting for our flight...that was supposed to be leaving right about now. It is now theoretically scheduled to depart at 10:30pm. I am tracking our plane which is coming in from Virginia or something....it is in the air. We are being positive that it might happen tonight.

If not, we know some other people in NYC and have already alerted them that we may be calling them to hang out tonight and who knows how long after that.

The key to getting through something like this is to be with a travel partner. When one of you sinks to a low of frustration...the kind of state where you feel like fire-bombing the place...that the other person stay relatively upbeat and productive. As long as the two of you stay out of phase everything will be fine. If the both of you sink to a low together, you're done for.

Good times.


p.s. Delta Airlines sucks

Thursday, July 19, 2007

If you're into paleontology...

...think about submitting to a new blog carnival called The Boneyard.

Wednesday, July 18, 2007

Why is this lady so against conserving energy?

Click here to read a short interview on CNN.com with a woman named Trilby Lundberg. She is the publisher of the Lundberg Survey, a survey of United States gasoline prices quoted regularly by news outlets and others.

The beginning of the question-and-answer report has some interesting insight and remarks about the complexity behind what determines the actual price at the pump. And then she says a few things regarding the outlook for fuel costs in the near term future (next 5-10 years) and the role of alternative fuels.

This is all fine and good. There's a few things I would quibble with and maybe disagree with, but no big whoop.

But then, the questioning turns to the notion of energy conservation. I'm just gonna clip the whole part here, as it is worth reading.

Q: As far as conservation, what are the trends you are seeing?

A: I'm hoping that consumers will see through the rhetoric about consuming less, demanding less, as faulty. It is not a given that consuming less will be good for our economy or for our personal freedom. It is not even established for our environment that we [should] deprive ourselves of gasoline for our personal mobility as well our commerce. And to suppose that it is good to do that, and pretend that we have consensus and put our heads together to deprive ourselves of this great product that makes the country go around, commercially and individually, I think is flawed. I'm hoping consumers and voters will see through that and be able to ignore some of the most extreme suggestions.

She then, of course, goes on a little diatribe about the great hoax of global warming. But, I don't want to focus on that here. What really floors me is this attitude that conserving energy means depriving ourselves of it. This is so illogical and I just don't understand it. Yes, I agree...it is a product that makes the country (and the world for that matter) go round. Shouldn't that be reason #1 to conserve it?! Why are some people so anti-conservation? I simply do not get it. We can be a nation of economic prosperity and continued high quality of life AND be much more energy efficient. It's not all or nothing....that's the biggest bunch of malarkey.

Whatever happened to the idea of a "penny saved is a penny earned"? The generation of Americans who actually lived through the Great Depression and had to conserve are all but gone.

And then there's this gem at the end.
...taking into account the many, many millions of people around the world that envy our way of life, it would seem more humanitarian to wish them the kind of plentiful petroleum products and vehicles ... that we enjoy ... to lift themselves out of [a] backward, poor way of life
Right.
Wake up to the 21st century, lady.

Formation of the English Channel

If you are plugged in today, you've likely seen the report about a paper in this week's Nature about a ice dam-bursting megaflood scouring event that is thought to have produced the English Channel. I simply don't have the time at the moment to comment on this in any detail....so here's a few blurbs from a New Scientist report.

Half a million years ago, Britain was connected to mainland Europe by a broad chalk ridge that spanned what we now call the Dover Strait (or the Pas de Calais in French). But somehow that ridge was destroyed, forever separating England and France.

The cause was revealed by an ultrahigh-resolution sonar survey of a large chunk of the channel's bedrock. It shows the Weald-Artois Ridge, as it is called, was breached and toppled by a monumental torrent that gushed from an overfilling glacial lake that the ridge had been damming on its northern side.

Not so long ago, I posted about the Channeled Scablands of the northwestern United States.

The Imperial team calculates that 1 million cubic metres of water per second flowed for several months to carve the seafloor valleys, some of which are up to 10 kilometres wide and 50 metres deep. The flow rate was 100 times the average of the Mississippi river today, and 1000 times that of the Rhine, Gupta says.

It turns out a study in 1985 hypothesized these features and inferred processes from some much lower resolution sonar data. Must be kind of cool to see your theory confirmed with higher resolution data like that.

The BBC has a good summary of the Nature paper too.

Submitting manuscripts online

So, I submitted a paper the other day, which was all accomplished with the internets. It was through the Manuscript Central web service, which i'm sure many of you have used. Their service hosts some 1,700 books and journals, which seems fairly ubiquitous.

Anyway...my overall experience was pretty good. Online submission has improved by leaps and bounds in just the last couple of years. This service is pretty slick....it integrates your main text document and all your figures and tables into a single PDF that is ready for download by your peers for review. It would be nice to have that capability when I'm preparing drafts of papers for co-authors and such. Obviously, it's not that difficult to prepare an integrated PDF these days, but still....to have one magical button that does it for you would provide more time for more important things.

But....I did have one problem. The figure upload feature tells you to paste your captions into a dialog box and they will automatically be associated with the figure and placed on a page preceding that figure in the final PDF. It didn't work. So, I had to be that guy who emails the editors and tell them something went wrong and my submission is incomplete. I hate being that guy.

Tuesday, July 17, 2007

Came across a new geoblogger

I came across a relatively new geology-focused blog called Growth Faults today. Not many posts up yet (it's only a few weeks old) but already a couple of good ones (one on the blog's namesake and another on dolomitization).

I've already added Growth Faults to my sidebar links and to GoogleReader... it's nice to see our community growing. Welcome.

One FYI to the author in case you read this....I couldn't leave a comment without a WordPress account. I have left comments on many other WordPress blogs, so i'm not sure what's up with that.

Americans moving to areas with greater seismic hazard

The lower map shows the population change from 1990 to 2000 for the lower 48 of the United States. The brown colors are areas of net loss and the purple areas of net gain. The upper map shows seismic hazards. Clearly, people are moving from the central United States, and area of low seismic hazard to other areas (especially in the Colorado Plateau and Basin and Range regions) that have higher seismic hazard. But why? More excitement in their life?

A great mapping website, called the National Atlas (nationalatlas.gov), allows you to make outrageous and spurious claims like this with very little effort. It's great fun.

For example you could see if there's a spatial correlation between mudpuppy distribution and number of aggravated assaults. Or, maybe the range of the Greater Bonneted Bat has a relationship with impact crater distribution!

Seriously though....this is pretty dang cool that the feds put this together. They have so many categories of information. And to be able to interactive show them on a map is just fantastic.

Here is just a sampling of what you can map:

  • Agriculture
    • crop type
    • land usage
    • livestock
  • Biology
    • amphibians (that's what a mudpuppy is, apparently)
    • bat ranges
    • butterflies
    • invasive species
    • ecoregions
  • Climate
    • average precipitation
    • tornadoes
    • sea-surface temperature
  • Environment
    • superfund sites (that one's a little scary)
    • toxic release inventory
    • water discharge permits
  • GEOLOGY
  • People
    • crime
    • unemployment
    • population density
    • median age
    • energy consumption
  • Transportation
    • railways
    • airports
    • interstates
and so on....

Really an incredible resource. Have fun!

Phytoplankton bloom in North Atlantic

All I really got goin' on today is a pretty picture.

This is an image from a few weeks ago of the North Atlantic (note Iceland in upper right) showing fantastic swirling clouds of phytoplankton. To check out the original image and more information click on photo to go to the Earth Observatory website.


via Geology.com

Sunday, July 15, 2007

Another disappearing lake

Last month, news about the disappearance of a glacial lake in Chilean Patagonia spread around the media outlets and geoblogosphere. A lot of the discussion since has been focused on whether or not this event is indeed just the latest example of anthropogenic global warming.

This reminded me of a story of a disappearing lake that is without a doubt the result of human intervention. This is crazy...check it out. In 1980, Lake Peigneur in Louisiana catastrophically drained into the ground creating a swirling vortex that sucked barges and other boats into it.

The short version is: they drilled an oil well into an active salt mine. When the drill hole met the subsurface cavity....well, watch this History Channel footage (>6min) below. They go into much more detail and have some incredible footage.

The final stretch

The end of my PhD journey seems to be racing towards me rather quickly. I have a very loose, informal, "theoretical" defense date of December. My committee thinks this is reasonable but when I look at my calendar, I start to get a little nervous about it happening. What I learned from doing a master's, however, was that if you mark a date on a calendar months in advance the value comes in the motivation to make that date. Even if things get pushed back slightly, the idea is that if you hadn't marked that date in the first place, then you wouldn't have made as much progress. But....now that i'm already slightly waffling and rationalizing about making that date, can I say that the motivation is there? Ummm.....what?

Anyway, my particular program has, in the last 10 years or so, gone to a more "modular" dissertation. That is, instead of writing one, ridiculously long tome about a single project we have multiple projects that fit within a "theme", for lack of a better word. There are perhaps some disadvantages to the modular style that one could think of, but I think the advantages far outweigh them. Firstly, the separate projects or sub-projects are summarized in chapters that are meant to be stand-alone papers. This has been valuable to me because then the papers are already in a format suitable for a journal. Why write a 500 page monstrosity nobody is gonna read anyway and then have to transform it into a journal manuscript later?

If you read this blog semi-regularly, you can probably guess what my "theme" is. All of my chapters deal with deep-marine sedimentary sytsems in one form or another. Some aspects deal with fundamental processes more, whereas others are utilizing attributes of the system (distribution, composition, timing, etc.) to address geologic questions of the specific region.

I'm writing this post because the first major paper of this work is about to be submitted (finally). I remember saying I wanted to submit this back in April! The paper went a couple rounds with co-authors and advisor and is now ready. Today, I have to do some of the remaining annoying little tasks (e.g., tracking down the volume number for that one pesky reference). It feels good to have this chunk (nearly) done. In terms of finishing the PhD and getting through the defense, the more of my chapters that are already submitted to a peer-reviewed journal, the better. Having all of your work submitted by defense date is not necessarily required here, but things go much, much smoother if they are. Realistically, I'll have 2/3 of my work submitted by December with the remaining very close.

So, that calendar seems to be marked with bigger font and in bold now. It is no longer an "idea" or "something to shoot for", but is transforming into a real day. A day that will be here a lot closer than I think.

As for my post-PhD plans....I will post about that another time. Several months of individual soul-searching combined with discussions with my girlfriend about what she wants to do next, where would we want to live (or definitely not live), and so on. As you know, it gets compli-ma-cated. That deserves its own post.

Saturday, July 14, 2007

A wildlife documentary right outside our window

Our apartment is on the 3rd floor of a corner building and we have two big, beautiful trees just outside our windows. In fact, the branches are so close they very nearly touch the windows when the wind blows hard enough. Last weekend we noticed (to be fair, our cat gets credit for first noticing) a hummingbird nest on one of these branches.

It's kind of difficult to see in the photo above but there are two little hummingbirds in there. The nest itself is shaped like and about as big as a teacup. We aren't sure how long this nest had been there, but once we saw it we watched the mother come back from time to time and feed her offspring.

The photo above is a close-up of the little guys waiting impatiently for mom to return with some eats. This was last weekend. They are now gone...over the course of the last two days they each went out on a limb (literally) and then eventually flew away.
I kind of miss them....so does our cat.

Friday, July 13, 2007

Friday Field Foto #23: Flame structures


Today, we have another sedimentary structure commonly seen in turbidite successions. The features above that look like flames are called.......drum roll........ flame structures (brilliant!). Right in the center of the photograph notice the slightly darker and curved lines in the rock. They meet upwards at a tip and are pointing to the right.

Flame structures form as the upper part sinks into the underlying sediment, often referred to as 'loading'. This loading commonly occurs in localized pods and then the sediment in between gets squeezed up a bit. The directional component of this (the tip of the 'flame') is produced because there is still some current strength which shears the material just slightly before everything comes to rest as a deposit. So, in the case above the local current direction was left to right.

How does loading occur in the first place?
Firstly, the underlying bed cannot be completely dewatered. That is, it is still a mixture of sediment and water is likely in a 'soupy' state. Secondly, there needs to be a density contrast. The overlying material has to sink into the soupy bed to be able to displace the material like this. You may have seen flame structures before where coarser material (usually sand) sinks into much finer-grained material. But, in this case all the material is sand of similar grain size. The density contrast is set up because the overlying sediment has much more water in it still. Remember, sediment gravity flows are a mixture of sediment in suspension and water....this is very different than fluid flows where the sand is transported as bedload.

So, what does this tell us?
In this case, if you were to examine this deposit laterally away from where this photo was taken the loading and flame structures disappear and the bed is completely homogeneous. This is just a localized structure within a bed and not a boundary between discrete events. Turbidity currents commonly exhibit 'surging' behavior. As the flow moves down-slope it will begin to separate into multiple sub-flows. Or so we think....our knowledge of how these things actually work is incredibly limited.

Thursday, July 12, 2007

Where on (Google)Earth #27?

The Where on (Google)Earth? quiz started on this blog back in January of this year has grown up and transformed into a community-based series. Many more geo-nerds are getting involved and the installments are featuring oblique views from time to time. I finally had a chance to solve one in time so now it comes back to me. The last one I did was #14 and this is #27!!

I feel like a proud parent. My kid went off to bigger and better things and has now come back for a short visit.

I can never tell anymore what is difficult and what is easy in WoGE. People seem to solve ones ridiculously fast in some cases. I didn't include a scale on this screenshot...it's a few miles across...or something.

Wednesday, July 11, 2007

HiRISE images of Mars

The image above is from the Marte Vallis region of Mars and nicely shows some mass wasting on the hillslopes.

The High Resolution Imaging Science Experiment (HiRISE) is a camera aboard the Mars Reconnaissance Orbiter. The project is part of the University of Arizona and the website is a great portal into high resolution of Mars' surface.

They have a lot of the images tagged by categories such as mass wasting, tectonic processes, fluvial processes, and others. See all the science themes here.

Sunday, July 08, 2007

A two-hour and twenty-three minute GM commercial

I really didn't expect a movie from Michael Bay to be anything but the cheesiest cheese that Hollywood has to offer but I didn't expect Transformers to be a commercial.

These days movies have a lot of product placement and the like, but this one really takes the cake. All the vehicles, especially the good ones (Autobots), were GM....Chevy and Pontiac cars and GMC trucks. Any chance they got....I mean any....they had a close-up of the logo on the grill of the car/truck. It wasn't even subtle.

I was a kid in the '80s, had the Transformers toys, and watched the cartoon. One of the favorite characters was an old yellow Volkswagen bug, named "Bumblebee". This movie of course couldn't have a German car in it...so, they made Bumblebee a damn Chevy Camaro!! What!? He's supposed to be a cute little VW bug!! A#@holes!

The commercial....er, I mean movie....takes any chance it gets to have the leading girl lean over the car in her skimpy outfits. It looked like the cover of one of those hot rod magazines you see in the gas station on the road during a geology field trip.

Does GM really think this is gonna help their sales? Perhaps they oughtta work on designing and building cars Americans actually want to buy, instead of spending money on pushing the same junk. Anyone who goes out to buy a new Camaro simply because it was featured in this movie is the only customer GM has left.

We have crossed the line from movies that have a lot of ads in them to an advertisement that is disguised as a movie. The end is coming.


image above from Movieweb

Friday, July 06, 2007

Spectacular visualization of flight patterns

If you haven't seen by now...i'm a sucker for images showing complex patterns. I found a fantastic website that is part data visualization and part art. The author/artist of this project, Aaron Koblin, compiled flight pattern data from the FAA for the United States (and most of North America) and created stunning images and animations. The animations are really the coolest part of this...to see our flight transportation system like this is jaw-dropping. It looks like the flurry of activity you see on an ant hill...or something.

Here are a few of the images....check out the site for more.


The look and feel of the work reminds of the Cabspotting project that I posted about several months ago.

Friday Field Foto #22: Rip-up clasts

More turbidites!

I'm actually going to visit these rocks early next week for a couple days. This is north of the Bay Area near the charming little coastal town of Gualala (which is fun to say out loud).

In this photo (note coin for scale) we see a complex mixture of pebbly sandstone (near bottom), coarse sandstone, and siltstone and mudstone (darker-colored rock). Note how the coarse sandstone seems to surround the large area of dark mudstone. The mudstone areas are actually clasts within a thick (>5 m) sandy turbidite bed. We call these "rip-up clasts" as they were deposits on the sea floor that were ripped up by a subsequent turbidity current, incorporated into the flow as a clast, and eventually deposited. Muddy material can be quite cohesive and can stay together as a coherent clast like this. Think about making a mudball vs. a sandball with your hands. The sand disaggregates much easier.

As mudstone rip-up clasts go, these are probably slightly above average in size. We commonly see smaller (centimeter scale) and once in a while you'll see a deposit with larger rip-up clasts.

Thursday, July 05, 2007

Diabolical propaganda

Depending on your mood, this will make you laugh or it might make your skin crawl.

On Rush Limbaugh’s radio show Tuesday, a 13 year old caller named Patrick complained that he was forced to read “liberal magazines like Time and Newsweek” in school which explained the globe was getting warmer. The caller said he was skeptical of the science because “my parents have always been skeptical of it.” Limbaugh then offered the following encouragement to the caller:

RUSH: Patrick, this will be a good lesson. There are liberals everywhere. You may think that just because your town is conservative — there are liberals. They’re hiding in the shadows, and they are lurking there, and they’re around and the odds are that many of them are in the school system. You’ll probably at some point probably have to watch [Al Gore’s movie], unless your parents and other parents find out about it and demand, “If you’re going to show this movie, you better show the Great Global Warming Swindle and put the other side to our kids out there.” Well, congratulations. I’m glad you called and told us this. This is the kind of thing that gives us all encouragement for the future. Here you are at 13, already aware of when you’re watching propaganda. That’s great.


How Orwellian is that!? Denounce propaganda as you spew it. Hmmm....the "other side".... why are people so goddamn preoccupied with distilling every issue to "sides"? If an asteroid doesn't destroy our civilization, then this dangerously oversimplified dualistic worldview will.

Okay....back to work. I need to do some evil scientific research. I wonder if Rush considers Sedimentology a liberal journal?

via ThinkProgress

Wednesday, July 04, 2007

Real Earth vs. GoogleEarth

I took some photos the other day as we were landing in San Francisco. The picture below is looking to the northeast, that is the town of Fremont and the East Bay hills.

Now compare with the GoogleEarth view...this was as close as I could get it to match.

That's it...I don't have anything interesting to say about that.
Happy Fourth of July!

Global socio-economic cartograms

As an Earth scientist I live and breath maps.

I recently came across the site Worldmapper, which has nearly 400 global cartograms of various metrics. A cartogram is basically a map that shows area re-sized according to the variable being mapped. Worldmapper metrics include things like immigration, wealth, resources, housing, health, disease, education, and many others.

For example, below is a map showing the global distribution of scientific research for 2001 (defined as the number of published scientific papers by authors living in that nation). Further analysis would obviously require the raw data (which you can get off this site as well), but viewing the results in a map form like this conveys a lot of information immediately. The United States, Europe, and Japan (that dark purple blog on the right) stand out as "big" areas while areas like Africa, Central America, and Southeast Asia are "small".


Another example shown below is a cartogram of crude petroleum exports. Note the big players: the Middle East, Venezuela, Mexico, Norway, and parts of Africa. Nations where imports exceed exports (e.g., the United States) are not shown.

Tuesday, July 03, 2007

Sediment accumulation rates and bias: The Sadler effect

A key element to understanding sediment flux is the determination of accumulation rates in areas of net deposition. How fast (or slow) is sediment piling up? How is that rate distributed in space? How does it change over time? What does it tell us about the controls of sediment flux?

Sweet. This is simple. Just measure the thickness of sediment (or sedimentary rock), divide by the duration, and interpret! Well...it turns out it's not so simple after all.

This post is a little bit about a very important paper that I don't see cited enough.

Sadler, P.M., 1981, Sediment accumulation rates and the completeness of stratigraphic sections: Journal of Geology, v. 89.

The main gist of the paper is summarized nicely in the first statements of the abstract:

"A compilation of nearly 25,000 rates of sediment accumulation shows that they are extremely variable, spanning at least 11 orders of magnitude. Much of this variation results from compiling rates determined for different time spans: there is a systematic trend of falling mean rate with increasing time span."
In other words, the longer the time interval measured the lower the sedimentation rate. The image below is Sadler's Figure 1 with some of my scribblings on it. It is a log-log plot of sedimentation rate (meters per 1000 years) on the vertical axis and timespan (years) and thickness (meters) on the lower and upper horizontal axes, respectively. For now just focus on the 'a' figure...the one on the left. And also don't worry about the Roman numerals (i, ii, etc.).


The trend is pretty obvious. The data in the upper left have very high sedimentation rates, were measured over very short time intervals (hours to months), and are relatively thin. The area to the lower right represents sedimentation rates several orders of magnitude slower and have measured time intervals in the millions to 10s of millions of years. There's some spread in the data of course, but in general this is a robust trend. What is underlying this relationship?

The tendency for sediment to compact as it buried (and thus be thinner) is a contribution but does not account for the bulk of the relationship. What you are seeing here is essentially the nature of sedimentation. It is discontinuous and highly spasmodic. In most depositional environments, the duration of actual deposition of sediment is very small compared to the time the system sits there doing little to nothing. I think Derek Ager said the history of sedimentation is like being in the military....hours of boredom separated by brief moments of terror.

So, we are seeing the effect of including more time of non-deposition (i.e., nothing happening) as we increase the span of the measured time interval. But wait...there's more! We are also seeing the nature of sediment preservation over geologic time scales. That is, the farther back into time we go, the more time of erosion is included (remember, these systems are net-depositional...there is some erosion occurring). The younger the section, the more "complete" it tends to be. Sadler discusses this issue of preservation and stratigraphic completeness very elegantly with this statement:
"Sedimentary sequences...record the passage of geological time as an alternating set of sedimentary increments and gaps. The ratio of these two components is stratigraphic completeness."
Sadler certainly was not the first to recognize this (another famous paper by Barrell, which I will post about someday, is notable for discussing completeness back in 1917) but this paper was the first to quantify it. A sizeable chunk of the paper goes through methods for calculating completeness.

Several recent studies, including the pioneering paper by Molnar & England (1990), discuss the apparent increase in sedimentation rate observed in the last 20-30 million years. This has led to countless discussions about whether this signature is recording changing uplift rates or changing climate. Now of course we shan't attribute this trend solely to Sadler's measurement interval bias, because there very well may be an actual increase in rate. But, the point of this post is to highlight Sadler's work and how we shouldn't forget about it. Many of these papers do not even mention it. Sampling bias as a result for a study is not very exciting and probably won't result in the cover of Nature or Science, but if we are to adequately deconvolve all the factors at play we need to remember biases like this.

Molnar, P., and England, P., 1990, Late Cenozoic uplift of mountain ranges and global climte change: chicken or egg? Nature, v. 346.

Monday, July 02, 2007

Sediment Flux and Luggage Carousels

Research that I have been doing recently involves the study of sediment flux. That is, what is the history, the temporal distribution, of the erosion, transport, and deposition of sediment. From the erosion of a particle in the uplands, into a river system, perhaps spending some time in a coastal system, and then into a deep marine basin. I've been looking at a temporal scale of hundreds to thousands of years, but one could examine this at a scale of millions of years. Of course, the farther back into Earth history, the lower the resolution. Moreover, the farther back in Earth history, the more fragmented is the contextual information about the system. Investigating sediment flux requires a lot of context

The ultimate question is, of course: what are the controls on sediment flux? Can we deconvolve interacting factors including, but not limited to:

  • climate (e.g., increased precipitation leading to increased runoff/streamflow)
  • sea-level stands (e.g., lowstands of sea level during glacial maxima)
  • tectonic movements (e.g., increased uplift rate of sediment source area leading to increased erosion rate)
  • intrinsic behavior of the sedimentary system (e.g., meandering of a river, migration of dunes and other bedforms, distributive patterns, etc.)

This is what I spend my time pondering. Earlier today I was standing at the luggage carousel in the airport. Everybody stands there staring at the mouth of the conveyor from where their bag (hopefully) appears. We stand there and wonder what controls the order, why the delivery of bags come in clusters, and other nonsense....essentially, we are wondering what is controlling the flux of luggage. Well, maybe only I wonder this.....anyway, all we have to do to figure this out is simply observe what is happening on the other side of the luggage delivery system.

I don't really care about luggage delivery systems...I just want my bag. But I do care about sedimentary systems. It's definitely more complex than the carousel too. In the coming weeks I am going to post more about this area of my research. Check out a post from February in the meantime.

Image at top of Santa Ynez Creek, California; from Jon Warrick's work

A few photos from vacation

I'm sittin' in Denver International Airport on my way back to California. We spent a week in the north woods of Minnesota, in the Boundary Waters Canoe Area. I had never been....it was fantastic. Yes, there were some mosquitos but they weren't as bad as I had imagined. Besides, we were in a nice cabin and not camping...so that was a bonus. We spent the week paddling around the lake, exploring small bays, watching the wildlife, and relaxing. Very nice...I needed it.

I need to catch up on some of latest and greatest in the geoblogosphere....in the meantime, check out some of these photos from the Boundary Waters.