Showing posts with label marine science. Show all posts

Wednesday, August 22, 2007

Paper out in Geology

THIS POST CAN BE FOUND AT NEW BLOG, CALLED CLASTIC DETRITUS, HERE

A paper i'm a co-author on is in the September edition of Geology. I'm swamped right now and don't have time to write a coherent post about it....but I will soon.

In the meantime, check it out (if you have access, of course):

Highstand fans in the California borderland: The overlooked deep-water depositional systems
Jacob A. Covault, William R. Normark, Brian W. Romans, and Stephan A. Graham


Monday, August 06, 2007

More submarine territoriality

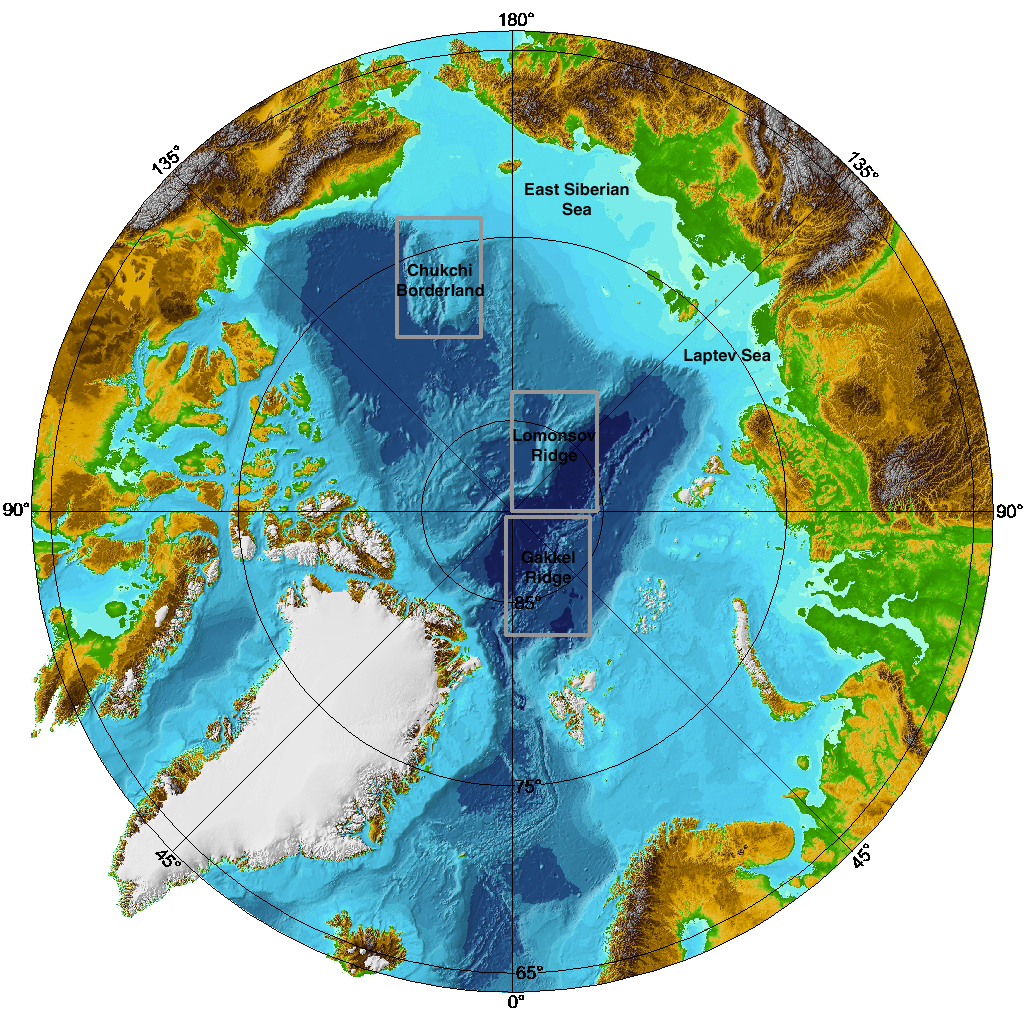
My previous post dealt with Russia's claim of that the Arctic's Lomonosov Ridge belongs to them since it once was part of the Siberian continental shelf. It seems Argentina may have some issues about what part of the submarine landscape is theirs as well. Check out this short article from IPS (via geology.com). I don't have the time right now to dig into this one in any detail, but here's a blurb:

To draw up a definitive proposal for its maritime border, in 1997 Argentina created the National Commission of the Continental Platform Exterior Limit (COPLA), an inter-ministerial technical team that reportedly has already gathered 90 percent of the information necessary to demonstrate exactly where its territory covered by the ocean comes to an end.

Countries with ocean coasts have sovereign rights over the sea bed and subsoil to 200 nautical miles from land, which is known as the exclusive economic zone, or to where its continental platform ends, including the slope, up to a maximum of 350 miles. That includes the platform's natural resou
rces, but not the water that covers it.

The data obtained in laboratories and sea missions will have to be presented before May 2009 to the Commission on Continental Platform Boundaries, a technical body of the United Nations Convention on the Law of the Sea, which will decide whether to authorise the new border demarcation.
Unfortunately, this article does not show a map of the area in question (wouldn't the citizens of this globe be so much more knowledgeable of geography if maps were always included?! .... but I digress).

Below is a map showing the topography and bathymetry of southern South America. The Argentine continental margin is a very different geologic situation than the one I discussed in the last post. This is a passive margin with a relatively wide continental shelf.

Argentina may have a better argument than Russia on this one. At least the shelf is still attached to the continent here.


If anyone, especially anyone reading this from South America, knows any more details about this, please don't hesitate to post a comment.

Click on the image to go to the source.

Sunday, August 05, 2007

Geology, geopolitics, and the Law of the Sea

In the international game of territorial rights, geology matters.

Russia made news last week with their largely symbolic flag-planting on the Arctic sea floor at the north pole. The Arctic region is thought to host significant amounts of petroleum resources and, as the world's demand for oil continues to grow combined with the disappearance of sea ice, nations wish to claim as much of this real estate as they can before exploration operations begin.

There is plenty of commentary out there on the blogs about this story specifically and the notion of Arctic oil exploration in general (e.g., here, here, and here) so I'm not going to focus on that. When I came across the short news article in this week's Nature, I became more interested in what criteria are used to decide which nation gets what when it comes to the sea floor.

The Nature article is here, you'll have to have a full license to see the whole thing, but I will quote a bit of it below.

The 1982 United Nations Convention on the Law of the Sea (UNCLOS) allows states an economic zone that extends 200 nautical miles from their coastline. To increase this, countries must prove to the United Nations Commission on the Limits of the Continental Shelf that their physical continental margin extends farther than this.
The map from the Nature article (right) shows the 200 nautical mile line as a blue dotted line. Russia thinks they deserve more. They are claiming the Lomonosov Ridge is an extension of their continental shelf, which would significantly extend their sea floor territory.
If Moscow can prove that the structure of the continental shelf under the ocean is geologically similar to that of Russian land, it may be able to extend its territory. The Lomonosov Ridge, which it sees as a continental extension, is key to its claims. Russia hopes to claim 1.2 million square kilometres and, with it, the rights to copious mineral and fossil-fuel reserves.
Check out the full UN Convention on the Law of the Sea treaty here. If you go to the section on the continental shelf, you'll find this statement as part of the definition:
The continental margin comprises the submerged prolongation of the land mass of the coastal State, and consists of the seabed and subsoil of the shelf, the slope and the rise. It does not include the deep ocean floor with its oceanic ridges or the subsoil thereof.
Emphasis mine. My first impression is that the Lomonosov Ridge, being an oceanic ridge and all, should therefore not be part of the definition of a states continental shelf territory. If a state disagrees with this determination, then they need to formally contest it with this UN entity, which they did, according to the Nature article:
In 2001, Russia became the first country to make a submission to the United Nations. It was told to supply more information, in particular about the Lomonosov Ridge, which runs under the Arctic Ocean between Russia and Canada. Russia claims this ridge is an extension of its Siberian shelf, but this is hotly contested by Canada and others.
What is the Lomonosov Ridge? I'm not an expert on Arctic geology, so I welcome any comments or links to better sources (especially resources in Russian). A quick search uncovered a 1992 Geology paper by Jokat et al.:
The 1500-km-long and 50-70-km-wide ridge rises 3 km above the adjacent abyssal plains and divides the Arctic Ocean into the Eurasian and Amerasian basins.

The ridge is postulated to be a continental fragment severed from the margin during the early Cenozoic opening of the Eurasian basin.
The Jokat et al. paper makes some conclusions about the origins of the ridge based on multichannel seismic-reflection data they acquired:
The geometry and attitude of the deposits below the ridge unconformity strongly suggest the Lomonosov Ridge is the remnant of a prograding continental shelf facing the Makarov Basin.

The progaded ridge flank facing the Makarov Basin indicates an early history of slope-rise sedimentation into the basin that existed before the Lo
monosov Ridge separated from Eurasia.
On the map at the top of the post, the Makarov Basin is the region shaded in orange above where it says Lomonosov. Assuming these conclusions are correct, then Russia's (and maybe Norway's little section) paleo continental shelf did include what is now the oceanic ridge. But, of course, the determination is on the present configuration, right? Well, Russia is indeed claiming that since the ridge originated as part of the Siberian shelf, then it is still theirs.

Talk about opening a can of worms. Imagine if the UN allowed arguments of current territorial boundaries to be determined by where the territory was 10s of millions of years ago! That would get interesting.

How will all of this affect scientific research in the Arctic? I think it's a double-edged sword in many ways. The prospects of opening the region to resource development will create major problems for researchers getting access to certain areas. On the flip side, a lot of mapping and imaging of the sea floor needs to be done to figure all of this out. The UN has said that their is "insufficient data" to resolve this. I'm certainly hesitant to be gung-ho about opening the relatively pristine Arctic region to petroleum operations, but, at the same time I get excited about the prospects of increasing our overall understanding of that region through sea-floor mapping, which is very expensive.

It will be interesting to see how this all shakes out.

Get more information about the map above here.

Note: this post cross-posted on August 8th, 2007 edition of www.geology.com/news
Additional information on Lomonosov Ridge from Olelog here.


Cold War Goes North; Kommersant

Wikipedia's page on the Lomonosov Ridge, which has a nice collection of links related to Russia's territorial claim.

W. Jokat, G. Uenzelmann-Neben, Y. Kristoffersen, and T.M. Rasmuessen, 1992, Lomonosov Ridge; a double-sided continental margin: Geology, 20(10):887-890

Friday, August 03, 2007

High-resolution sea-floor image offshore San Diego

Just a quick post today to show you one of the latest multibeam bathymetric images released by the US Geological Survey. Go to this page to view and download the large-format PDFs.

If you'd like to know more about the technical details of the concept, design, and acquisition of multibeam sonar data, check out resources here and here.

This one is definitely worth clicking on to see the high-res version. The densely populated onshore area to the right is San Diego, California. For a more regional context of southern California geologic provinces, check out this page. The San Andreas fault is 10s of km inland from this location, but subsidiary strike-slip faults dominate the tectonic fabric.

The major submarine canyon cutting into the narrow continental shelf is called La Jolla Canyon. The head of that canyon comes very close to the pier at Scripps Institute of Oceanography if any of you have been there. Note the transition from the deeply incised submarine canyon to a submarine channel system as you go into deeper water. Also note the meandering nature of the individual channel "threads" within the belt. This submarine channel eventually empties into the elongate San Diego Trough basin, which is off the image to the left and in even deeper water.

A paper that i'm a co-author on is coming out in Geology next month and deals with this canyon-channel system in more detail and its history over the last 40,000 years. I will post about that soon, so stay tuned.

The USGS page also has some great perspective views....here is the link again, check it out.

Tuesday, July 17, 2007

Phytoplankton bloom in North Atlantic

All I really got goin' on today is a pretty picture.

This is an image from a few weeks ago of the North Atlantic (note Iceland in upper right) showing fantastic swirling clouds of phytoplankton. To check out the original image and more information click on photo to go to the Earth Observatory website.


via Geology.com

Wednesday, May 30, 2007

Blogging at sea

Go check out the series of posts in the last few days over at Deep Sea News. They are blogging while at sea. Good stuff.

I especially like this post for this beautiful bathymetric image of Monterey submarine canyon...how fantastic. They are observing the biology in these high relief areas of the canyon and its tributaries.

Tuesday, May 29, 2007

Making waves

Back in April I showed a multibeam bathymetric (sea floor topography) map from offshore Half Moon Bay not too far down the coast from San Francisco.

PopSci has a nice little article talking more about how the underlying structure that produces the sea-floor topography as well as the coastal promontory focus the wave energy toward a point called Mavericks. This has some of the biggest waves on the west coast of North America and hosts an annual surfing competition.


Check out this virtual fly-over animation as well.

Tuesday, May 22, 2007

NEPTUNE sea laboratory

NEPTUNE (North-East Pacific Time-Series Undersea Networked Experiments), which I posted about last month, will be a state-of-the-art observational system in the ocean and on the sea floor off the coast of Oregon, Washington, and British Columbia. It will deliver data real-time and be interactive

This is very exciting. The Earth's oceans are the last frontier on this planet regarding scientific exploration and observation. We still have yet to actually document many of the processes that occur in the submarine realm. The NEPTUNE website (check it out...it's pretty cool) lists a few of these:

  • massive storms
  • erupting submarine volcanoes
  • giant earthquakes
  • marine mammal feeding and hunting patterns
  • phytoplankton blooms in the upper ocean
  • releases of microbes that live in the rocks beneath the seafloor and thrive on a diet of volcanic gas
And, of course, what everybody wants to see caught in the act -- turbidity currents!
Oh wait...I guess that's just me.
Sediment transport is indeed one of their goals...I will be very interested to see the data come in and published in the coming years.

Thursday, April 26, 2007

Structural deformation revealed on sea-floor image

As you've seen from previous posts on this blog (e.g., here, here, and here) I have a penchant for images of sea-floor bathymetry. Not only are they fascinating (and aesthetically pleasing) but they constantly remind of us of how much we don't know about our own planet surface (remember, 2/3 of the Earth's surface is under water). We have mapped the surface of Mars better than Earth!

A recent Deep Sea News post reminded me of a great web resource if you are interested in marine science. It is called SIMoN, which stands for Sanctuary Integrated Monitoring Network, is a portal for all things related to the Monterey Bay National Marine Sanctuary. Much of the site involves the biological and habitat aspects (it is a sanctuary after all) but there is also great stuff regarding the geology and geomorphology of the area.

The image below (see page on SIMoN here for all the details) is from an area offshore of the central California near Half Moon Bay (just south of San Francisco and north of Santa Cruz). This area is called Mavericks and is a popular surfing spot.


What is most striking is how nicely the structural deformation of Pliocene sedimentary rocks is shown with this image. Movement on the San Gregorio fault (a wholly owned subsidiary of the San Andreas) has produced this folding and the layered nature of the strata has resulted in the differential erosion and alternating ridges and 'valleys' seen on the bathymetry.

Wednesday, April 18, 2007

Sea-floor laboratory offshore British Columbia, Washintgton, and Oregon

Yes! More sea-floor laboratories! I posted just last week about a somewhat similar plan for Monterey submarine canyon. This one is in the northeastern Pacific Ocean, offshore of BC, Washington, and Oregon.

Here are the highlights from this article in ScienceDaily:

  • NEPTUNE (North-East Pacific Time-Series Undersea Networked Experiments) is a joint U.S.-Canada venture led by the University of Victoria in Canada and the University of Washington in the United States.
  • Located in the northeast Pacific on the active Juan de Fuca tectonic plate.
  • NEPTUNE will allow scientists to monitor biological, oceanographic and geological processes over a period that could stretch to more than two decades.
  • Six unmanned sea floor nodes, each roughly the size of a sport utility vehicle and each hosting an array of instruments, equipment and video cameras will be installed on the ocean floor in Canadian waters.
  • The first stage of NEPTUNE is scheduled to start in summer 2008.

Let's hope their equipment doesn't get destroyed by a turbidity current.....on the other hand....we could use the data :)

Thursday, April 05, 2007

Deep sea observatory in Monterey Bay

This is really cool -- check out the article on ScienceDaily.

In a multi-institution effort managed by the Monterey Bay Aquarium Research Institute (MBARI) and funded by the National Science Foundation, 52 kilometers (32 miles) of cable were laid along the seafloor of Monterey Bay. This undersea cable will provide electrical power to scientific instruments, video cameras, and robots 900 meters (3,000 feet) below the ocean surface. It will also carry data from these instruments back to shore, for use by scientists and engineers around the world.
MBARI is a very cool organization, I was able to go out on a short research cruise last fall, which was a great experience. Very high tech...exploring the deep sea floor is like exploring another planet. It will be exciting to see how well this new system works out.

Thursday, March 29, 2007

Giant sandy bedforms seaward of the Golden Gate Bridge

High-resolution sea-floor mapping done in 2004 and 2005 by the US Geological Survey (USGS) and Cal State Monterey Bay (CSUMB) reveals a field of gigantic sand waves just west of the Golden Gate of San Francisco Bay.

More than 40 large sand waves were mapped, with crest-to-crest lengths of as much as 220 meters and heights of as much as 10 meters. Although the tidal range is not huge here, the narrowness of the Golden Gate straight augments the tidal force significantly (tidal currents > 2.5 m/s). Note in perspective bathymetric images how the area directly under the bridge (blue/purple colors) is kept clean of sediment.


Here is a short synopsis from the USGS's website.

Here is an article from the San Francisco Chronicle from last summer.

Check this out for another submarine view of San Francisco Bay.

Friday, February 09, 2007

JSW #5: Sediment Transfer from the Continent to the Deep Sea

This is post #5 for Just Science week.
Today's installment is also cross-posted over at Deep Sea News today.


As we all know, the deep sea contains fantastic records of ancient oceanic conditions. The deep sea also holds clues about the continents. In this case, we can use deep sea sediments to better understand how Earth surface systems respond to climatic fluctuations. The inherent relief between continental and ocean plates drives the transfer of sediment from the shoreline to the deep ocean. A grain of sand lodged from a decomposing rock in the mountains may spend a long time making its way down a river system, or being swashed around at the coast, but ultimately the deep sea is the final resting place. In other words, this is as low as it can go. Combine this with a high volume of sediment over time and the result is an accumulation (sometimes several kilometers thick) for geologists to examine.

Studies of sediment transfer within this context has been coined “source-to-sink” and involve the integration of several Earth science disciplines including sedimentology, geomorphology, hydrology, mineralogy/petrology, geochemistry, marine geophysics, and others. A big chunk of my current research is a collaborative source-to-sink project between Stanford University and the U.S. Geological Survey. We are focused on the sediment records housed in the deep marine basins of the California Continental Borderland region offshore southern California (image at top of post). The wrenching effects of the San Andreas transform fault system have created a highly segmented seascape with valleys, ridges, mountains (some of which stick out as islands), and deep basins.

Using multibeam bathymetry, seismic-reflection profiles, and core samples, we can map the distribution and flux of continentally-derived sediment in these basins. The image above is a seismic-reflection profile from the Santa Monica Basin showing the nature of the basin fill2. High-resolution mapping of the sea floor reveals a complex geomorphology complete with canyons, leveed channels, and fans. The image below is a perspective image3 of Hueneme submarine canyon, the main sediment feeder to this basin.


So, what are we finding out in these studies? A radiocarbon-dated Ocean Drilling Project core in Santa Monica Basin is tied to the seismic-reflection survey providing time constraints to the maps of sediment distribution. We then calculated the volumes of sediment that had accumulated over the last 7,000 years. The average flux over this time is approximately 3 million tons of sediment per year, which is a lot. But more interesting than the absolute numbers, is the variability of this rate at shorter time scales (hundreds of years). A couple thousand years ago, the sediment flux rate increases by a factor of five and is then much more variable from then on. What is causing this variability in flux? This is the primary question we are working on now. Some paleoclimate records for the California coast4 indicate a shift from weaker and fewer El Niño’s to stronger and more frequent El Niño’s around this same time. Since the main source of sediment to this basin is a river we can begin to connect these climatic fluctuations directly to the record of sediment flux. These preliminary results are from a recent presentation at the AGU conference5 in December 2006. This study will be submitted for publication soon.

Ultimately, the record of sediment transfer that is stored in the deep sea (modern or ancient) will tell us a great deal about what was happening on the continent regarding the interactions of tectonism, climate, and Earth surface processes.


References:

1 Perspective image created in GeoMapApp, a fantastic freeware program for exploring the world’s bathymetric database. Download here: http://www.marine-geo.org/geomapapp/

2 Normark, W.R., D.J.W. Piper, and R. Sliter, 2006, Sea-level and tectonic control of middle to late Pleistocene turbidite systems in Santa Monica Basin, offshore California: Sedimentology, v. 53, p. 867-897. Explore this dataset online at: http://pubs.usgs.gov/of/2006/1180/index.html

3 Bathymetry of the northeastern Channel Islands: http://walrus.wr.usgs.gov/pacmaps/ci-persp.html

4 Barron, J.A., L. Huesser, T. Herbert, and M. Lyle, 2003, High-resolution climatic evolution of coastal northern California during the past 16,000 years: Paleoceanography, v. 18, no. 1.

4 Romans, B.W. and Normark, W.R., 2006, Distribution and rates of terrigenous sediment accumulation on the Hueneme submarine fan in the late Holocene (4.3 ka – present), Santa Monica Basin, California: AGU December 2006 Meeting.


Monday, February 05, 2007

JSW #2: Submarine Geomorphology

This is the second post for the Just Science week (Feb 5th-9th) on ...Or Something.
See the first post here.


from USGS; see more here

The resolution and coverage of both sea-floor mapping and subsurface seismic-reflection technology has grown by leaps and bounds over the last couple of decades. The above image is a perspective image of the Los Angeles, California area onshore topography and offshore bathymetry. Note the relatively flat continental shelf (green), very defined shelf edge, and variably steep continental slope leading to the deep sea (dark purple). The shelf edge and shelf is incised by submarine canyons that deliver terrigenous (i.e., derived from continent) sediment to the deep ocean. Many of these canyons and channels are sitting out at the shelf edge and are inactive now. During Last Glacial Maximum (~18,000 years ago) sea levels were much lower and the shoreline was essentially at the shelf edge. Some of these canyons are still active at present, however. On Friday of this week I will have a post about research I've been doing recently studying the flux of terrigenous sediment to one of these basins.


get original image here

This next image (above) is a map-view of the bathymetry offshore of Monterey, California (please check out MBARI's website for more great images of the sea floor). Monterey Bay is in the upper right of the image with the head of Monterey submarine canyon smack-dab in the middle between Santa Cruz to the north and the town of Monterey to the south. Monterey Canyon is a huge feature...follow it out seaward and the canyon transitions into a submarine channel with a beautiful meander that's barely on this image. The distance from the canyon head to that meander, called Shepherd Meander, is approximately 125 km (75 mi) to give you a sense of scale. The water depth at that meander is approximately 3400 m (11,150 ft). Monterey Canyon is one of the most studied and well monitored submarine canyons in the world. Turbulent gravity-driven flows carrying a lot of sand are responsible for carving out this fantastic feature over long time scales (hundreds of thousands to millions of years). This paper from 2004 by colleagues of mine, Andrea Fildani and Bill Normark, is a great resource for understanding the geologic history and sedimentary processes related to the formation of Monterey Canyon.


Three-dimensional seismic-reflection technology allows us to create maps of buried geomorphic features. The images shown at right and below clearly show beautiful meandering channels that were once on the sea floor (in very deep water) and are now in the subsurface. By analyzing 'slices' within the seismic volume we can map the evolution of the geomorphology through time. These images from a recent paper from Posamentier & Kolla (2003).


Utilized together, bathymetric images from the modern sea floor and seismic-reflection images from the buried sea floor are spawning new branches of geomorphology that are focused on deep-marine processes and evolution. I envision more and more collaborative efforts in the future among subaerial (i.e., on land) and submarine researchers of Earth surface processes.


Posamentier and Kolla, 2003, Seismic geomorphology and stratigraphy of depositional elements in deep-water settings, Journal of Sedimentary Research, Vol. 73, No. 3

Sunday, February 04, 2007

JSW #1: Sediment thickness in the world's oceans

For my first post of JSW (Just Science week, Feb 5-9), i'm going to introduce my field of study, sedimentary geology, with an illustration. Much of the rest of this week, I will be discussing more than you've ever wanted to know about the sedimentation along continental margins. Actually, I have no idea what i'll be posting about...that's my guess...you'll have to stay tuned.

The above figure, which can be found here, shows the thickness of sediment in the world's oceans and marginal seas. I love this map...it is really great to get a global view like this. Like many others investigating patterns of nature, it is necessary to look at all scales. This post starts out big....the whole globe. Subsquent posts will zoom in spatially as well as pull back temporally and get a sense of past conditions.

One of the first things to focus on is the continents of North and South America. At this scale the configuration (and history) of the tectonic plates clearly governs the patterns (see map of plate boundaries below). Note the asymmetry of sediment thickness....the eastern margins of the land masses have thick accumuations (the hotter colors) of sediment whereas the western margins do not. The active western margins consist of a subduction margin in South America, transform margin in southern North America, and subduction margin in northern North America at a very large scale. This activity, although it creates a lot of high relief nearshore producing sediment, is not the best place to preserve sediment over long time scales.


The accumulations along the eastern, or "passive" margins, are so thick because they've been piling up for 10s of millions of years. These two strikingly different tectonic settings should be kept in mind.

Another notable pattern on the map of sediment thickness is the Bengal submarine fan. This fan, which sits in the Bay of Bengal between India and southeast Asia is the single largest accumulation of sediment on the planet (extending for nearly 30 degrees of latitude from the margin!).

Big deal. So, you may be asking so what...why should we study these accumulations of sediment? I hope to show you with a series of posts why I think it's interesting from a scientific standpoint to figure these things out. From the small-scale processes of transporting/depositing sediment to the spectacular geomorphology present on the sea floor to the implications to studying Earth history.

And, by now, i'm sure most of you may have also noticed the spatial coincidence of some of the thicker accumulations with petroleum provinces. This is no coincidence for sure....where you pile up a bunch of sediment over a long period of time you get the perfect host for our world's (for better or for worse) lifeblood. I'm not going to go too much into this particular application of sedimentary geology...at least not this week. My aim is higher....I want to learn as much as I can from these sediments/rocks. I'm a data junkie...I'll admit it. I want to observe and characterize information about the Earth....i'll take it where I can get it. I've been working on a post about 'peak oil' from a sedimentary geologist's perspective....but not this week. This week, i'll be using this information to tell you something (hopefully) interesting about our planet.


map of tectonic plates found here

Wednesday, December 13, 2006

Under the sea

I've spent the better part of the last 6 years studying deep-marine sedimentation (how dirt from the land gets to the bottom of the ocean). One of the coolest things about this are images like the above. It is a perspective view looking north of onshore and offshore southern California. I'm constantly fascinated by the landscape on the sea floor....mountains, valleys, canyons, channels, plains. Some of those mountains are sticking up out of the water as islands. We have the surface of Mars mapped better than our own ocean floor. It's like looking at another planet...I love it! Currently I'm studying Santa Monica Basin, which is towards the top of the image...the yellowish-greenish patch to the left of Los Angeles.

If you want to explore the world's sea-floor topography, you can download this Java program that accesses online databases (kind of like GoogleEarth but for underwater). It's called GeoMapApp, it's a little clumsy and sluggish sometimes, but still pretty fun.

Friday, November 03, 2006

Friday Field Foto #3: Big Sur coring cruise

This week I had an opportunity to go out on a research cruise with the Monterey Bay Aquarium Research Institute (MBARI) to do some deep-sea exploration of submarine canyons offshore of the Big Sur coast south of Monterey.

This is different field work than I'm used to. I've mostly been studying ancient deep-sea sediments (now exposed in mountains) whereas this trip was looking at modern deep-sea sediments.

They drop an ROV attached to a cable from a ship. This ROV can fly around just above the sea floor, has a robotic arm to grab stuff, and a bunch of cameras for observation. The analogy one of the guys on the boat made was -- imagine exploring the Grand Canyon by dropping a video camera in a Volkswagen beetle from a helicopter on a cable over a kilometer in length, during a moonless foggy night.

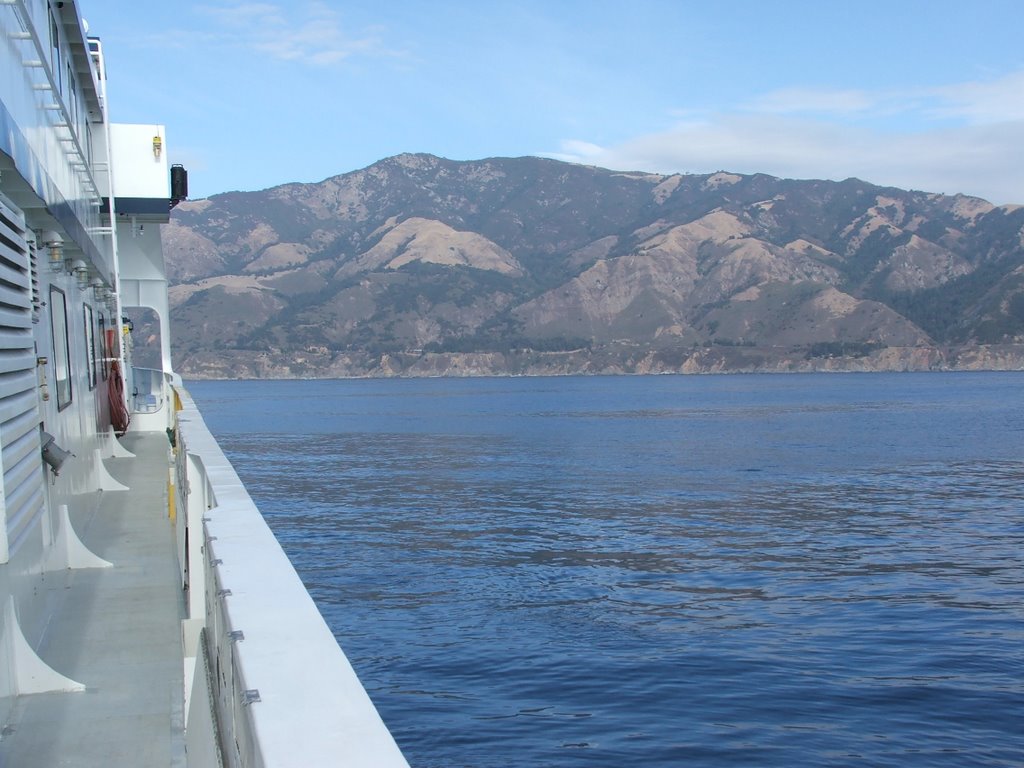
The image above was our view of the Big Sur coastline (you can even see Highway 1 if you look hard enough) while we were sampling one of the submarine canyons below.

The image below is an image of the sea-floor topography showing the canyons and channels cutting through the continental margin. The shelf edge is to the right in the orange color and the darker blue colors are getting to deeper depths (image courtesey of MBARI).